JCPenney Statistics and Facts for 2024
Last Updated on: December 13th, 2024
Here are a few of the most interesting JCPenney statistics and facts I was able to dig up including store count, revenue totals and employee counts. As always, be sure to check back in the future as I will be updating this post as new and updated stats become available.
JCPenney Facts
Here is pretty much everything you ever wanted to know about JCPenney.
- Website: Official Website
- Year Founded: 1902
- Headquarters: Plano, TX
- Founder(s): James Cash Penney and William Henry McManus
- Current Chief Executive: Ronald Tysoe
- Parent Company: Brookfield Asset Management and Simon Property Group
- App Download (iOS)
- App Download (Android)
JCPenney is an American department store chain founded in 1902 by James Cash Penney in Kemmerer, Wyoming. Over the years, it has grown into one of the largest retail chains in the U.S., offering a wide range of products, including clothing, home goods, beauty products, and electronics. Known for its wide selection of affordable, high-quality merchandise, JCPenney has long catered to middle-class shoppers looking for value and style. The store is especially recognized for its family-oriented shopping experience, offering clothing for men, women, children, as well as furniture, appliances, and home décor. JCPenney has embraced online shopping, with a strong e-commerce presence complementing its brick-and-mortar stores. While the company has faced challenges in the retail landscape, including competition from online retailers, it continues to adapt with strategic partnerships, seasonal promotions, and a focus on customer loyalty. JCPenney remains a staple in American retail, with stores across the country and a commitment to offering affordable fashion and home products.
JCPenney Store Count
Number of JCPenney stores:
- 2023: 650 stores
- 2018: 864
- 2017: 872
- 2016: 1,013
- 2015: 1,021
- 2014: 1,062
- 2013: 1,094
- 2012: 1,104
- 2011: 1,102
- 2010: 1,106
- 2009: 1,108
- 2008: 1,093
- 2007: 1,067
- 2006: 1,033
Top 10 states by number of JCPenney stores (as of 2/2/19):
- Texas: 82 stores
- California: 74 stores
- Florida: 53 stores
- New York: 39 stores
- Ohio: 37 stores
- Michigan: 34 stores
- Illinois: 29 stores
- Pennsylvania: 27 stores
- Missouri: 24 stores
- Georgia:, Indiana, Kentucky, North Carolina and Virginia: 22
(source)
JCPenney Revenue Totals
JCPenney net sales (annual):

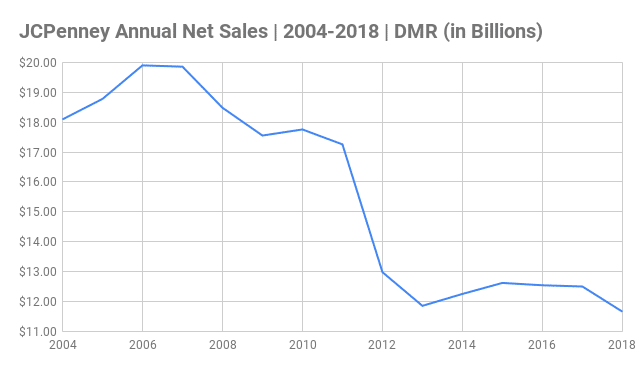
JCPenney Annual Net Sales Chart 2004-2018 (in Billions)
- 2018: $11.664 billion
- 2017: $12.506 billion
- 2016: $12.547 billion
- 2015: $12.625 billion
- 2014: $12.257 billion
- 2013: $11.859billion
- 2012: $12.985 billion
- 2011: $17.26 billion
- 2010: $17.759 billion
- 2009: $17.556 billion
- 2008: $18.486 billion
- 2007: $19.860 billion
- 2006: $19.903 billion
- 2005: $18.781 billion
- 2004: $18.096 billion
JCPenney net income (annual):

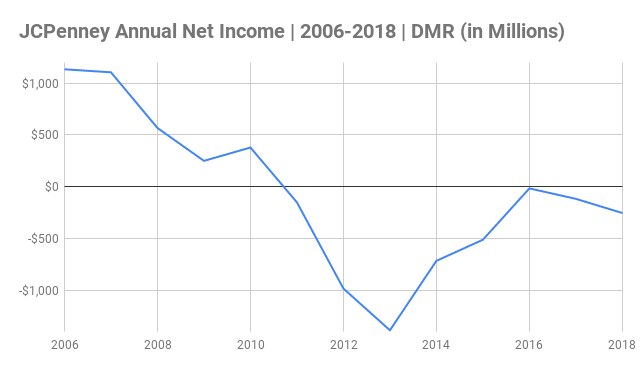
JCPenney Annual Net Income Chart 2006-2018 (in Millions)
- 2018: $255 million loss
- 2017: $118 million loss
- 2016: $17 million loss
- 2015: $513 million loss
- 2014: $717 million loss
- 2013: $1.388 billion loss
- 2012: $985 million loss
- 2011: $152 million loss
- 2010: $378 million
- 2009: $249 million
- 2008: $567 million
- 2007: $1.105 billion
- 2006: $1.134 billion
JCPenney revenue breakdown by division (2018):
- Women’s apparel: 22%
- Men’s apparel and accessories: 21%
- Home: 14%
- Women’s accessories including Sephora: 13%
- Children’s including toys: 9%
- Footwear and handbags: 8%
- Jewelry: 7%
- Services and other: 6%
(source)
Additional JCPenney Statistics
Largest merchandise segment JCPenney sold in 2017:
Number of JCPenney salons:
Number of JCPenney stores that have Sephora in them:
Number of JCPenney suppliers:
Please note that some of these numbers are easier to find than others. A few of these JCPenney statistics come from their own reports, but some are based on news reports and not official company tallies. No information contained on DMR should be relied upon to make investment decisions. Basically, this is the best I can find and I don’t guarantee anything to be 100%.
Related Categories:
Related Tags:
