Get the Full Google Stats Report
Here is a unique opportunity to get my six most popular Google product reports bundled at a discounted rate. This report includes Android/Google Play, Google Chrome, Chromecast/Google Home, Gmail, Google Search, YouTube and much more.
Here is another installment of "By the Numbers" and this may be one of my most ambitious statistics posts yet. Today, we look at Google search statistics and much more...
Google's influence on the digital marketing world is immeasurable and their influence touches just about every channel that we marketers work with on a daily basis.
Although Google has been doing some housekeeping over the past few years and have shed quite a few of their less successful products, they still have a bunch of products and there are endless stats that could be added to this list. I will be updating and adding to this list periodically, so if there is a Google stat you are looking for that you don't see here, let me know in the comments below!
Google Facts
- Google Release Date: 1998
- Google Parent Company: Alphabet
- Google Headquarters: Mountain View, Ca
- Google Founders: Larry Page and Sergey Brin
- Google CEO: Sundar Pichai
- Key Google Subsidiaries: YouTube, Android, DoubleClick, Waze, Nest, Fitbit, Snapseed
Important Dates in Google History
- The first Google algorithm, named BackRub, is developed: 1996
- Google.com domain registered: September 15, 1997
- Google AdWords launches: October 23, 2000
- Google News launches: 2002
- Google AdSense launches: June 18, 2003
- Google goes public: 2004
- Google.org is formed: 2004
- Gmail launches: April 1, 2004 (beta)
- Google purchases the Android OS: July 2005
- Google Maps launches: 2005
- Google purchases YouTube: November 13, 2006
- Google purchases DoubleClick: April 13, 2007
- Google Chrome launches: September 2, 2008
- The first Android-based phone is released: September 2008
- Google purchases Admob: May 27, 2010
- Google+ launches: June 28, 2011 (beta)
- Google purchases Motorola Mobility: August 15, 2011
- Google purchases Waze: June 2013
- Google launches Chromecast: July 2013
- Google reorganizes and creates the Alphabet holding company: August 2015
- Google+ shut down: April 2019
- Google launches Stadia: November 19, 2019
- Google purchases Fitbit: November 2019
- Google purchases Looker: February 2020
Top Google Search Competitors:
Google Search Statistics
How many Google searches per year?
Last updated 5/24/16
How many Google searches per month?
Last updated 10/12/15
Average number of Google searches per second:
Last updated 3/27/16
How many people use Google?
Last updated 2/11/13
Percentage of Google searches that return a featured snippet:
Last updated 10/23/19
Percentage of Google searches that return a 'people also ask' box:
Last updated 7/25/18
Percentage of mobile Google searches that return a direct answer box:
Last updated 4/17/18
Percentage of mobile Google searches that return at least 1 AMP result on the first page:
Last updated 4/17/18
Number of languages Google search is available in:
Last updated 9/24/18
Number of countries Google search is available in:
Last updated 9/24/18
Total monthly Google US desktop searches:
Last updated 1/22/16
Percentage of Google searches that come from mobile devices:
Last updated 10/12/15
Google's market share for U.S. search:
Last updated 4/28/20
Google's search market share for US desktops:
Last updated 1/22/16
Google share of U.S. mobile organic search market:
Last updated 4/25/19
Number of web pages indexed on Google:
Last updated 11/14/16
Google's share of China search engine market:
Last updated July 2015
Estimated monthly Google desktop searches in the US:
Last updated 8/31/16
Estimated monthly Google mobile searches in the US:
Last updated 8/31/16
Estimated monthly total Google searches in the US:
Last updated 8/31/16
Alphabet's (Google's parent company) market capitalization:
Last updated 8/3/18
Percentage of Google searches that are unique:
Last updated 5/14/18
Number of websites with Google AMP:
Last updated 2/15/18
Average number of AMP pages added weekly:
Last updated 3/7/17
Number of right to be forgotten requests that Google has received to date:
Last updated 2/27/18
Number of links Google has removed because right to be forgotten requests:
1 million links
Last updated 2/27/18
Percentage of links that Google has been requested to remove that they have removed:
Last updated 2/27/18
Percentage of all website referral traffic that comes from Google:
Last updated 12/21/17
Percentage of US organic search visits that are from Google:
Last updated 10/24/18
Percentage of all Google searches that are no-click:
Last updated 8/14/19
Top states for searching "local shops" in 2019:
- West Virginia
- New Hampshire
- Pennsylvania
- Rhode Island
- South Carolina
(source)
Number of people that use Google Discover:
800 million monthly active users
Last updated 7/31/19
Number of changes Google made to search in 2018:
Number of experiments Google performed on search in 2018:
Number of manual action notices Google sent to webmasters in 2017:
Number of manual action notices Google sent to webmasters in 2016:
Number of Google Cardboard VR headsets shipped all time:
Lat updated 2/28/17
Number of Google Cardboard app downloads all time:
Lat updated 2/28/17
Number of books in Google Books:
Last updated 10/17/19
Average amount of time that the average Project Loon balloon can stay in the air for:
Number of Google Employees:
Last updated 1/1/20
Google Bug Bounty program payouts (annual):
- 2019: $6.5 million
- 2018: $3.4 million
- 2017: $2.9 million
- 2016: $3 million
- 2015: $2 million
Amount Google spends on lobbying (annual)
- 2019: $11.8 million
- 2018: $21.7 million
- 2015: $16.66 million
Amount Google reportedly paid Apple in 2014 to become the default search engine on the iPhone:
Alphabet / Google Revenue Data:
Alphabet Q1 2020 Revenue:
Alphabet Q4 2019 Revenue:
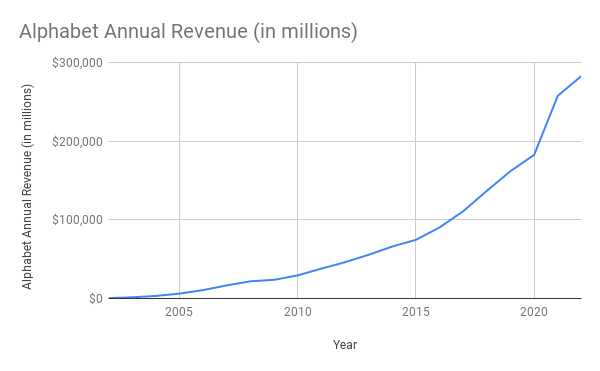
Alphabet Revenue (annual):
- 2019: $16185 billion
- 2018: $136.81 billion
- 2017: $110.86 billion
- 2016: $90.27 billion
- 2015: $74.54 billion
- 2014: $65.67 billion
- 2013: $37.45 billion
- 2012: $31.22 billion
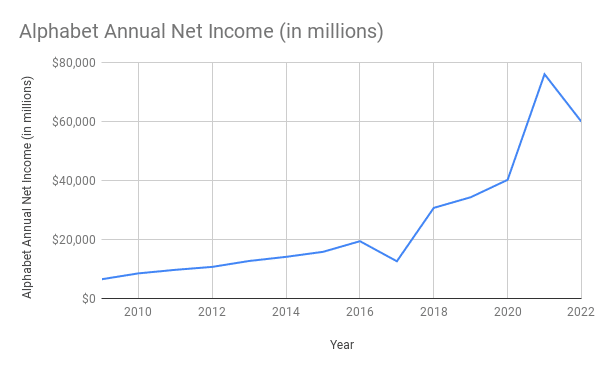
Alphabet net income (annual):
- 2019: $34.3 billion
- 2018: $30.7 billion
- 2017: $12.6 billion
- 2016: $19.4 billion
- 2015: $16.3 billion
Google Search revenue (annual):
- 2019: $98.1 billion
- 2018: $85.2 billion
- 2017: $69.8 billion
Google Cloud revenue (annual):
- 2019: $8.9 billion
- 2018: $5.8 billion
- 2017: $4 billion
Amount Google paid for Fitbit:
Between $2.1 billion
Amount Google paid for Bump:
Between $30-60 million
Amount Google paid for Nest:
Amount Google reportedly purchased Motorola Mobility for in 2011:
Amount Google reportedly sold Motorola Mobility for to Lenovo in 2014:
Top overall global Google search:
- 2019: India vs South America
- 2018: World Cup
- 2017: Hurricane Irma
- 2016: Pokemon Go
- 2015: Lamar Odom
Top global Google searched news story:
- 2019: Copa America
- 2018: World Cup
- 2017: Hurricane Irma
- 2016: US Election
- 2015: Charlie Hebdo
Top global Google searched person:
- 2019: Antonio Brown
- 2018: Meghan Markle
- 2017: Matt Lauer
- 2016: Donald Trump
- 2015: Lamar Odom
Top global Google searched actor:
- 2019: Jussie Smollett
- 2018: Sylvester Stallone
- 2017: Meghan Markle
- 2016: Tom Hiddleston
- 2015: Charlie Sheen
Top global Google searched athlete:
- 2019: Antonio Brown
- 2018: Tristan Thompson
- 2017: Floyd Mayweather
- 2016: Michael Phelps
- 2015: Lamar Odom
Top global Google searched movie:
- 2019: Avengers: Endgame
- 2018: Black Panther
- 2017: IT
- 2016: Deadpool
- 2015: Jurassic World
Top global Google searched TV show:
- 2019: Game of Thrones
- 2018: 延禧攻略
- 2017: Stranger Things
- 2016: Stranger Things
- 2015: Big Brother Brazil
Get the Industry Report
This report is available in an annual industry report. Some of the data in industry reports include:
- Google Search Stats
- Search/Display Advertising Stats
- Chromecast Stats
- Chromebook Stats
- Chrome and other Google App/Services Stats
- Gmail Stats
- Google+ Stats
- Etc.- all in one place
I try to go through each and every stat regularly and update as much as possible, but we all know that some stats are easier to track down than others. As always, every stat is linked to its original source and has the source date listed.
To get your copy of the report, click on the button below to purchase it.
Report 1: Google Product Report (Includes: Android, Chrome, Gmail, Google, Google Play, Home, and YouTube).
Report 3: Search Engine Company report bundle (Includes: Amazon, Baidu, Bing, Google and Yandex).
Report 4: Digital Titans Report (Includes: Amazon, Amazon Prime, Apple, Facebook, Google, Microsoft).
Report 5: FAANG Report (Includes: Amazon, Amazon Prime, Apple, Facebook, Messenger, Google, Netflix).
Percentage of Google searches that return a knowledge graph answer or box:25%(Tweet this stat)Last updated 1/16/15
Percentage of mobile Google searches that are voice searches:20%Last updated 5/18/16
Number of developers that have engaged with Google AMP:7,700 developersLast updated 10/6/16
Number of Google AMP pull requests all time:2,100Last updated 10/6/16
Number of documents that have been indexed in Google AMP:125 millionLast updated 10/6/16
Size of Google's search index data:100 million gigabytesLast updated 3/27/16
Number reconsideration requests Google receives:5,000 per week(Tweet this stat)Last updated 8/28/13
Percentage of Google searches that are secure searches:Approx 50%(Tweet this stat)Last updated 8/28/13
Number of Twitter pages indexed in Google:6.2 billionLast updated 7/10/14
Amount that global web traffic dipped when Google suffered a 5 minute outage:40%
Percentage of Internet users that Google themselves:56%Last updated 9/30/13
Top country for health-related Google searches:Cook Islands Last updated 7/24/15
Country with the least amount of health-related Google searches:ItalyLast updated 7/24/15
Top health-related Google search term globally:How to eat healthyLast updated 7/24/15
Number of URLs that Google was requested to remove from search in September 2013:21.5 million
Number of Monthly Unique Visitors to Google Sites:187 million(Tweet this stat)Last updated 3/25/14
Number of Digital Millennium Copyright Act (DMCA) notices that Google received in 2014:345 million
State that uses Google the most:UtahLast updated 1/8/14
State that uses Google the least:MississippiLast updated 1/8/14
Percentage of keywords for Google organic traffic to major news sites that is "[not provided]":87%Last updated 10/16/13
Percentage of referral traffic to major news sites that is from search:46%Last updated 10/16/13
Percentage of U.S. mobile users that visited a Google site in 2013:87%
New and expecting parents perform 2.7x more Google searches than non-parentsLast updated 5/8/14
Percentage of maternity-related Google searches that take place on a mobile device:56%Last updated 5/8/14
Google China's share of the Chinese search engine market (by revenue):11.91%Last updated 1/1/15
Amount of economic activity Google's search and advertising tools generated in 2013:$111 billion
Number of businesses that generated revenue from Google's search and advertising tools in 2013:1.5 million businesses
Percentage of Google keyword searches that return videos in the results:65%Last updated 6/18/14
Percentage of Google keyword searches that return images in the results:40%Last updated 6/18/14
Percentage of Google keyword searches that return news in the results:16%Last updated 6/18/14
Percentage of Google keyword searches that return shopping in the results:6%Last updated 6/18/14
Percentage of Google keyword searches that return maps in the results:1%Last updated 6/18/14
Estimated percentage of web traffic that comes from organic search:64%Last updated 6/11/14
Estimated percentage of web traffic that comes from paid search:6%Last updated 6/11/14
Percentage of Google's workforce that is male:70%Last updated 5/29/14
Percentage of Google's workforce that is female:30%Last updated 5/29/14
Reported amount interns at Google earn:$5,969 per monthLast updated 2/28/14
Amount Google spent on R&D in 2012:$9.8 billionLast updated 10/30/13
Number of miles driven by Google's autonomous cars:2 millionLast updated 10/5/16
Number of autonomous cars made by Google so far:nearly 60Last updated 10/5/16
Number of Google Fiber subscribers:200,000Last updated 10/6/16
Number of Chromebooks shipped in 2014:5.7 million
North America's share of all Chromebook sales:78%Last updated 10/23/14
Estimated number of Chromebooks shipped in 2013:2.1 million
Chromebook's share of all devices in U.S. classrooms:more than halfLast updated 12/3/15
Chromebook's estimated percentage of the U.S. commercial PC market:20%Last updated 12/23/13
Chromebook's share of all computer sales to businesses in 2013:10%
Chromebook's percentage of US back-to-school PC market:3%Last updated 10/2/13
Number of Chromebooks sold to schools in Q2 2014:1 million
Amount of North American web traffic driven by Chrome OS:0.2%Last updated 2/20/14
Number of Google Cardboards shipped to date:5 millionLast updated 1/27/16
Number of installations of Google Cardboard apps to date:25 millionLast updated 1/27/16
Number of hours of VR YouTube video watched on Google Cardboards to date:350,000 hoursLast updated 1/27/16
Number of photos taken to date with the Google VR camera app:750,000 photosLast updated 1/27/16
Number of countries that Google Cardboard is available in:100 countriesLast updated 10/12/15
Number of languages Google Cardboard is available in:39 different languagesLast updated 10/12/15
Number of Google engineers:25,000Last updated 9/16/15
Number of code changes Google's engineers make daily:45,000 changesLast updated 9/16/15
Percentage of Americans that won't wear Google Glass due to privacy concerns:72%Last updated 4/7/14
Lines of code generated from the Google Summer of Code program:50 million linesLast updated 10/8/13
Amount that Google spent on data centers during Q2 2014:$2.65 billion
Number of applications the Google Cloud Platform runs:4 millionLast updated 2/1/16