US Lottery Facts and Statistics for 2025
Last Updated on: May 29th, 2025
Here are a few of the most interesting US Lottery facts and statistics I was able to dig up in my internet travels. As always, be sure to check back in the future as I will be updating this post as new and updated stats become available.
The US Lottery refers to the various state and multi-state lotteries that operate in the United States. Lotteries are legal and regulated in most states, and are typically run by state governments or licensed third-party companies.
The US Lottery offers various games with different rules and prize structures, but they generally involve purchasing a ticket with a set of numbers and hoping that those numbers match the numbers drawn during the lottery drawing. Some of the most popular US Lottery games include Powerball, Mega Millions, and state-specific games such as California’s SuperLotto Plus and New York’s Lotto.
Lotteries are often used as a source of revenue for state governments, with a portion of ticket sales going toward funding various programs and initiatives such as education, infrastructure, and social services.
The US Lottery has a long history dating back to the early days of the country, with some of the earliest recorded lotteries being used to fund the construction of roads and public buildings. Today, the US Lottery remains a popular form of entertainment and a significant source of revenue for many states.
US Lottery Facts
Number of possible US Powerball ticket combinations:
Odds of winning Powerball jackpot:
1 in slightly over 292 million
Odds of winning Mega Millions jackpot:
1 in slightly over 302 million
Amount you’d have to spend (at $2/ticket) to buy every possible Powerball ticket combination:
Percentage of lottery winners that go broke within 7 years:
Date of Powerball launch:
1988 as Lotto America and April 1992 as Powerball
Biggest world lottery prize ever offered:
$1.58 billion (Powerball 1/13/16)
Odds of winning the Mega Ball Mega Millions Jackpot:
Largest Mega Millions prize ever offered:
Date of Mega Millions launch:
Size of the North American lottery industry:
State that introduced the first modern state lottery:
Number of US states that run lotteries:
Percentage of the American population that purchases a majority of lottery tickets:
Year scratch tickets were introduced in the US:

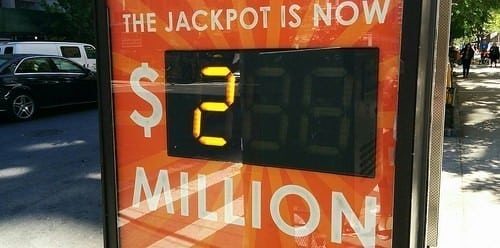
Photo by dylan nolte on Unsplash
The US lottery industry has captured the imagination of millions, offering the chance to transform dreams into reality. These 15 lesser-known facts about the US lottery have shed light on the immense odds faced by players, the financial challenges that winners may encounter, and the jaw-dropping prize amounts that have captured global attention. As lotteries continue to
Please note that some of these numbers are easier to find than others. Most of these fun facts come from internet reports and may not be official tallies. No information contained on DMR should be relied upon to make investment decisions. Basically, this is the best I can find and I don’t guarantee anything to be 100%.
