Uber Statistics and User Count for 2025
Last Updated on: May 29th, 2025
Here are a few of the most interesting Uber statistics and facts I was able to dig up including restaurant count, revenue totals and employee counts. As always, be sure to check back in the future as I will be updating this post as new and updated stats become available.
Uber Facts
Here is pretty much everything you ever wanted to know about Uber.
- Website: Official Website
- Year Founded: 2009
- Headquarters: San Francisco, CA
- Founder(s): Garrett Camp, Travis Kalanick
- Current Chief Executive: Dara Khosrowshahi
- Subsidiaries / Brands: Uber Eats, Otto, Jump Bikes, Careem, Drizly
- App Download (iOS)
- App Download (Android)

Uber provides a mobile app that connects passengers with drivers. Passengers can request rides through the app, specifying their pickup and drop-off locations. Nearby drivers who are registered with Uber can accept the ride request and provide transportation to the passengers. The app provides real-time tracking of the driver’s location and estimated arrival time.
Uber offers various types of ride options, including economy cars, luxury vehicles, shared rides, and more, depending on the region. The app provides upfront pricing estimates based on the pickup and drop-off locations, allowing passengers to know the cost of the ride before confirming the request.
Uber drivers use their own personal vehicles to provide rides to passengers. They go through a screening process that includes background checks, driving record checks, and vehicle inspections to ensure safety and quality.
The Uber app also handles payment transactions, allowing passengers to pay for their rides electronically through the app. Users can link their credit cards, debit cards, or other digital payment methods to their Uber account.
Uber has expanded its services beyond ride-hailing and offers additional options, such as Uber Eats, a food delivery service that enables users to order food from restaurants and have it delivered to their location. In select cities, Uber has also introduced other transportation options like e-scooters and e-bikes.
Uber operates in numerous cities around the world, providing a convenient and accessible alternative to traditional taxis and car services.
Uber History
- 2009 – Uber launches as UberCab
- 2011 – Uber launches in New York City
- 2011 – Uber expands beyond the US (Paris)
- 2012 – Uber launches in London and launches UberX
- 2013 – Uber launches in Latin America, India, China, Russia, Middle East and Africa
- 2014 – Uber launches UberPool and UberFresh
- 2015 – UberFresh becomes UberEats
- 2016 – Uber China is sold to Didi Chuxing
- 2017 – Dara Khosrowshahi replaces Travis Kalanick as Uber CEO
- 2017 – Uber launches Uber Freight
- 2018 – Uber launches Express POOL, Uber Cash, Uber Pro and Uber Rewards
- 2019 – Uber reportedly buys Careem for $3.1 billion
- 2019 – Uber launches Uber freight in Europe
- 2019 – Uber goes public
- 2020 – Uber acquires Postmates
- 2021 – Uber completes the acquisition of Drizly,
- 2022 – Uber acquires Australian car-sharing startup Car Next Door
- 2024 – Uber reports its first-ever profitable year
- 2024 – Uber announces the shutdown of Drizly
- 2024 – Uber collaborates with Avride to provide autonomous delivery robots and self-driving cars
- 2024 – Uber announces the closure of Uber Carshare, formerly Car Next Door
Uber Statistics
Uber User Count
How many people use Uber?
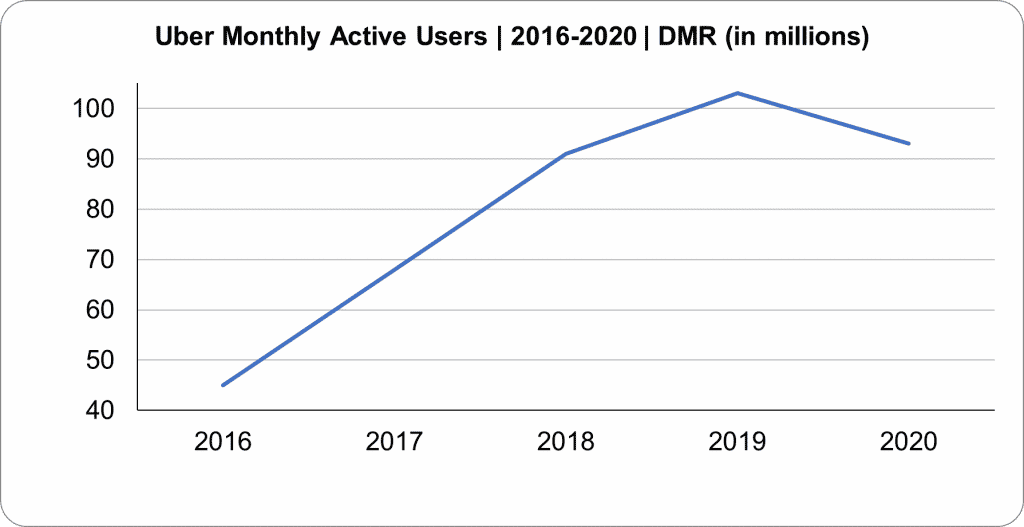
- 2024: 161 million monthly active users
- 2023: 142 million monthly active users
- 2022: 131 million monthly active users
- 2021: 118 million monthly active users
- 2020: 93 million monthly active users
- 2019: 103 million monthly active users
- 2018: 91 million monthly active users
- 2017: 68 million monthly active users
- 2016: 45 million monthly active users
Uber Monthly Active Users Chart 2016-2020 (in millions)
Number of Uber app downloads in 2018:
How many Uber drivers are there?
7 million Uber drivers as of Q1 2024
Uber Revenue Totals
Uber revenue (annual):

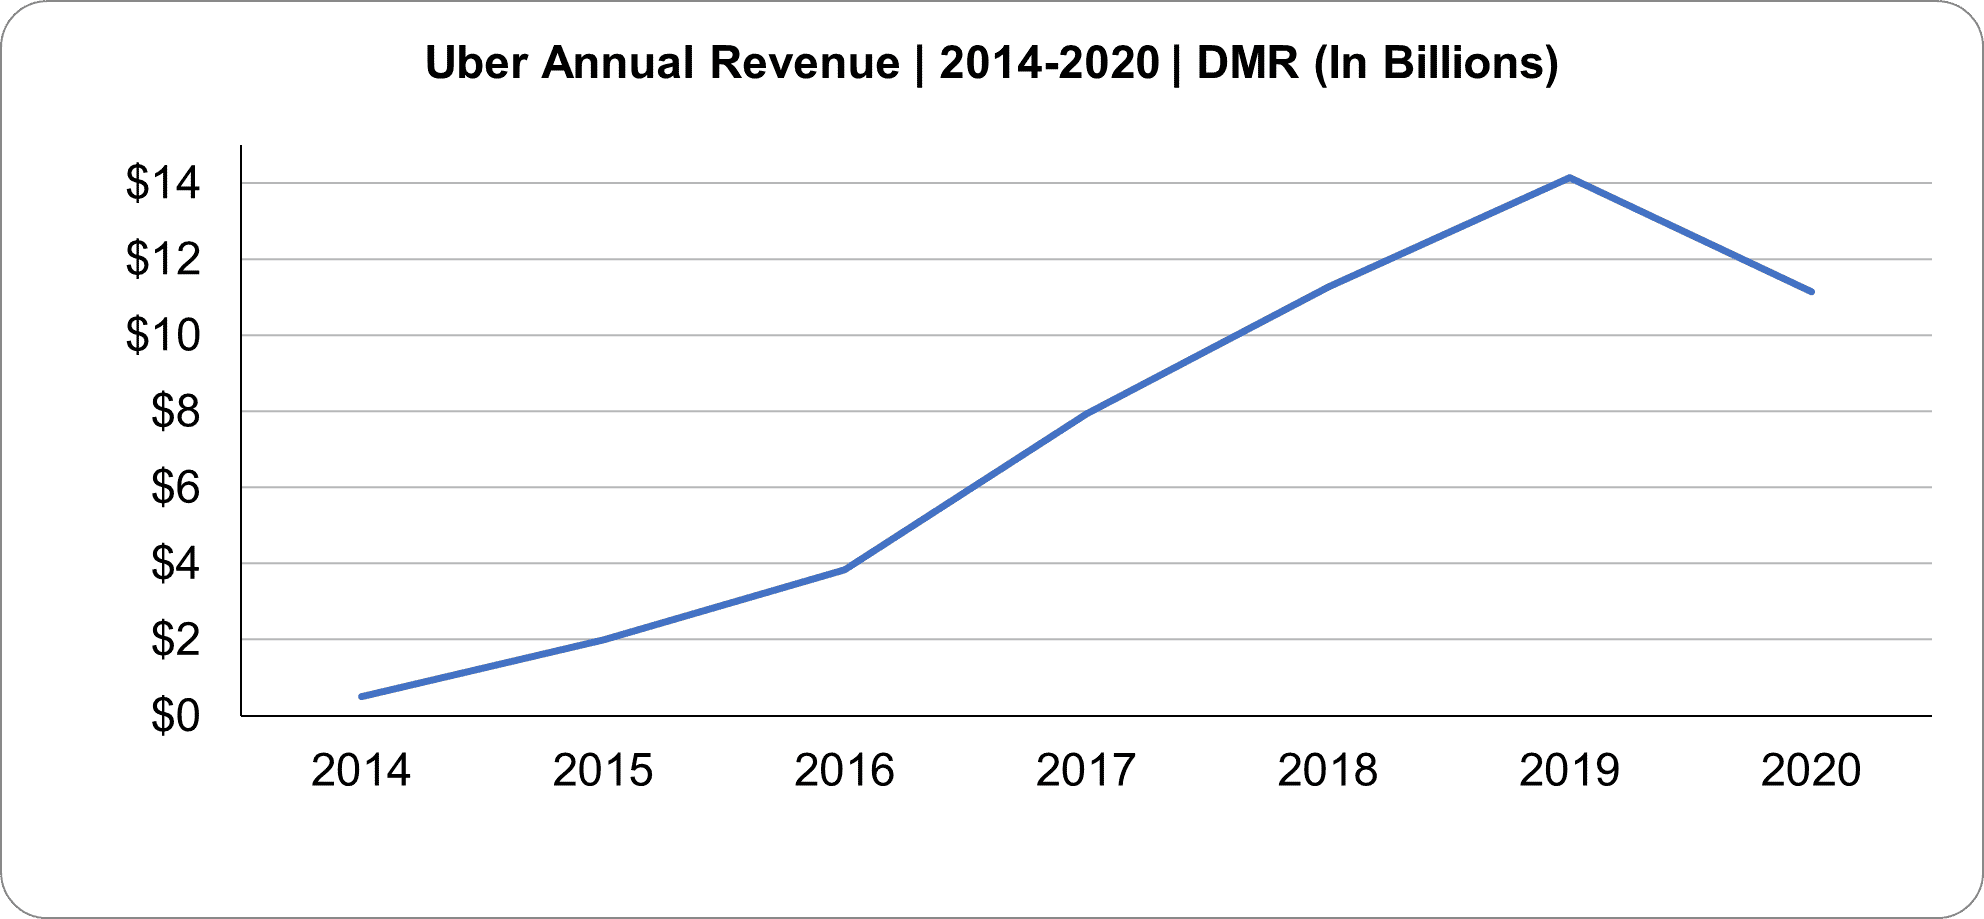
Uber Annual Revenue Chart 2014-2020 (In Billions)
- 2023: $36.6 billion
- 2022: $31.877 billion
- 2021: $17.455 billion
- 2020: $11.139 billion
- 2019: $14.147 billion
- 2018: $11.270 billion
- 2017: $7.932 billion
- 2016: $3.845 billion
- 2015: $1.995 billion
- 2014: $495 million
Uber net income (annual):

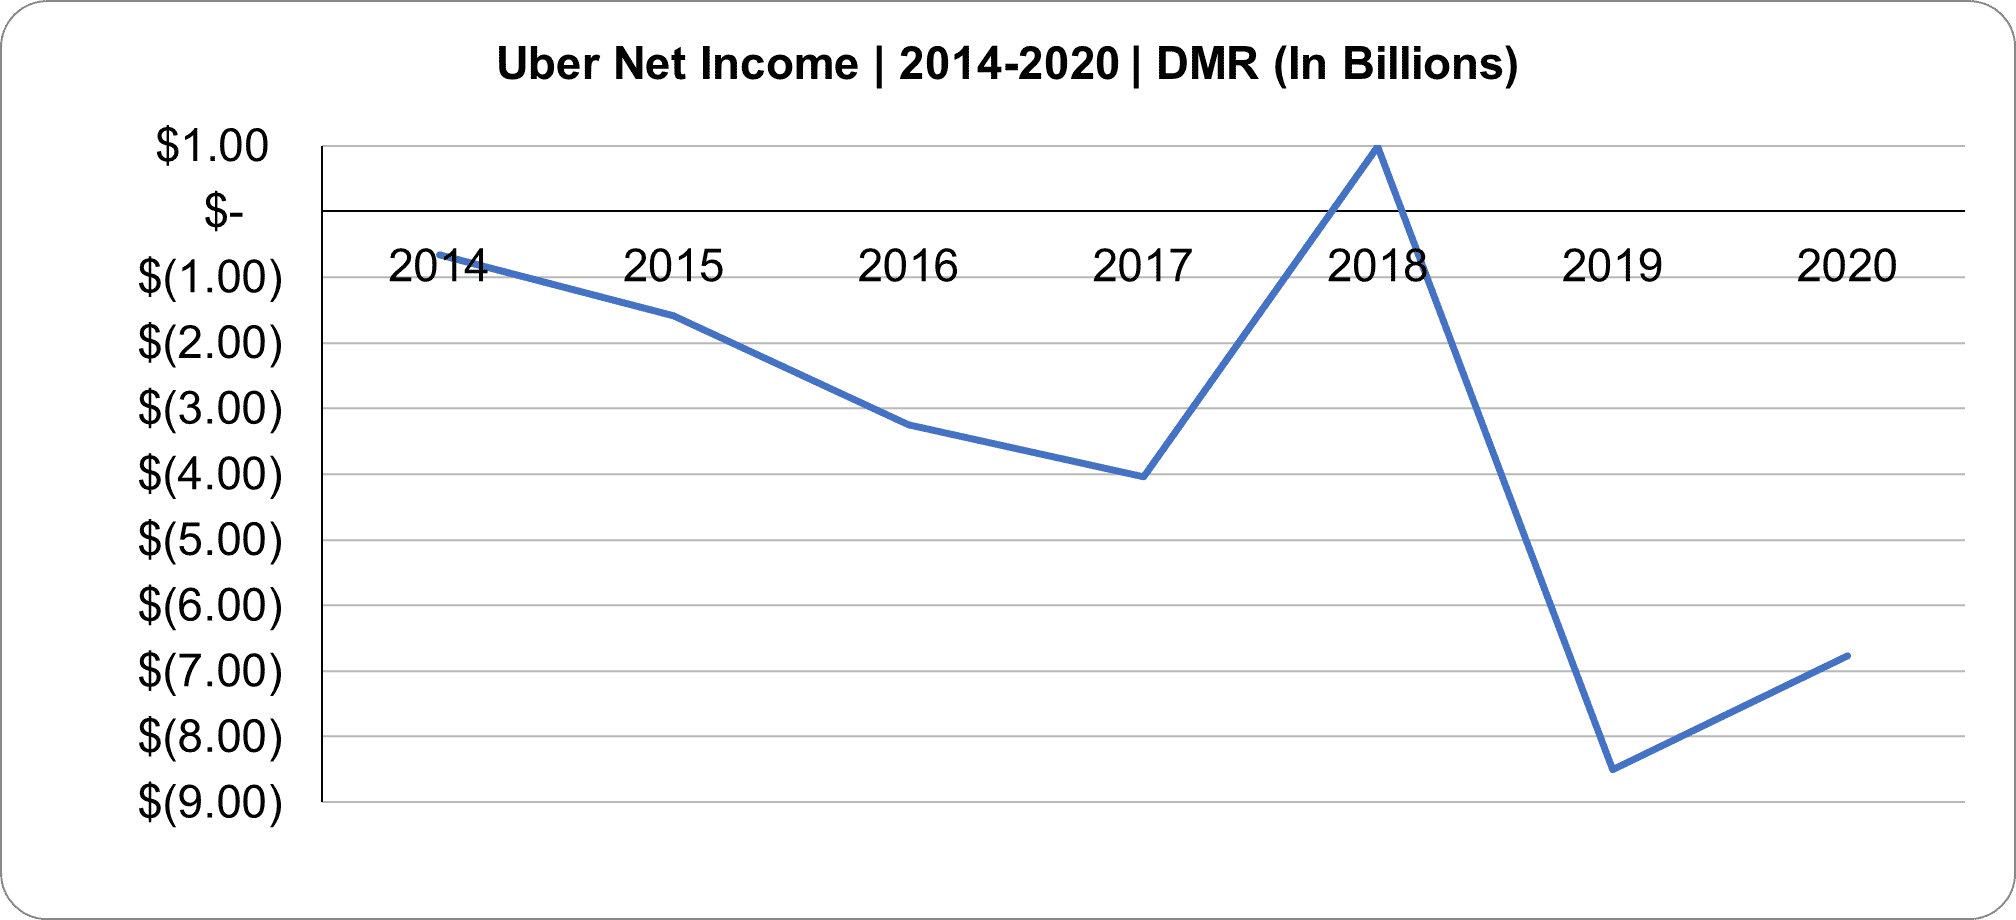
Uber Net Income Chart 2014-2020 (In Billions)
- 2023: $1.4 billion
- 2022: $9.141 billion loss
- 2021: $496 million loss
- 2020: $6.768 billion loss
- 2019: $8.506 billion loss
- 2018: $987 million
- 2017: $4.033 billion loss
- 2016: $3.246 billion loss
- 2015: $1.590 billion loss
- 2014: $653 million loss
Additional Statistics
Amount that Uber has paid drivers to date:
Average number of Uber trips per day:
Approximately 27 million trips per day on average. (2024)
Amount that Uber drivers earned in tips in the feature’s first year:
Number of cities Uber is in:
Number of countries Uber is in:
Uber’s share of the US hailing market in 2024
How many Uber users in London?
Reported amount Uber raised in funding:
According to their lost and found, the most common item to be forgotten in an Uber is a phone.
Number of Uber trips (annual):
- 2023: 9.4 billion trips
- 2022: 7.6 billion
- 2021: 6.3 billion
- 2020: 5 billion
- 2019: 6.904 billion
- 2018: 5.22 billion
- 2017: 3.736 billion
- 2016: 1.818 billion
- 2014: 140 million
Uber gross bookings (annual):
- 2023: $142.0 billion
- 2022: $115.395 billion
- 2021: $90.4 billion
- 2020: $58 billion
- 2019: $65.001 billion
- 2018: $49.799 billion
- 2017: $34.409 billion
- 2016: $19.236 billion
Uber total trips milestones:
- 1 billionth trip: March 2016
- 2 billionth trip: October 2016
- 5 billionth trip: September 2017
- 10 billionth trip: September 2018
Number of Uber Rewards members:
Number of Uber Employees:
19,000 Uber employees as of 5/8/18
Median hourly pay for Uber drivers in the US (with tip):
Number of Uber Freight downloads:
328,000 downloads as of 3/22/19
Percentage of US truckers that use the Uber Freight app:
Percentage of Uber drivers that were unemployed before working with Uber:
Percentage of Uber downloads in 2018 that came from Brazil:
Percentage of Uber downloads in 2018 that came from US:
Number of Uber drivers in Taiwan:
10,000 registered drivers as of 3/27/19
Number of Uber users in Taiwan:
Reported number of people who deleted their Uber accounts during #DeleteUber:
Uber’s share of the ride-hailing market in India:
Average number of Uber rides per week in India:
14 million rides per week as of 2/8/20
Amount that Softbank invested in Uber in late 2017:
Softbank’s reported ownership share of Uber:
Percentage of Uber’s employees that are men:
Percentage of Uber’s employees that are women:
Uber Eats Statistics:
Number of restaurants that participate in Uber Eats:
500,000 restaurants as of November 2024
How many people use Uber Eats:
50 million users as of September 2024
Uber Eats share of the global meal delivery market (by transactions):
Uber Eats revenue for 2019:
Uber Eats revenue for 2018:
Uber Eats gross bookings in 2018:
Number of cities across the globe that Uber Eats is available in:
Number of countries across the globe that Uber Eats is available in:
Amount Uber paid for Drizly:
Please note that some of these numbers are easier to find than others. A few of these statistics come from their own reports, but some are based on news reports and not official company tallies. No information contained on DMR should be relied upon to make investment decisions. Basically, this is the best I can find and I don’t guarantee anything to be 100%.
Related Categories:
