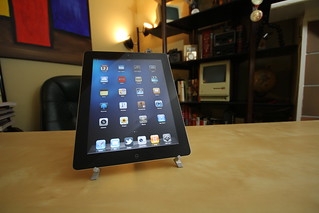
iPads burst on the scene and were a major disruption to the PC market right from the start. 9 years later, sales of iPads may have slowed a bit, but they are no less useful and still play a major role in our daily routines.
Here is a comprehensive list of the iPad facts and statistics that you need to know. This is an offshoot of my original Apple stat post that was becoming unmanageable with the amount of stats that had been added to it. I hope you find this data helpful.
iPad Facts and Statistics
Date of first iPad release:
April 3, 2010
iPad revenue for Apple (annual):
-
- FY 2023: $28.66 billion
- FY 2022: $29.29 billion
- FY 2021: $31.86 billion
- FY 2020: $23.7 billion
- FY 2019: $21.2 billion
- FY 2018: $18.3 billion
Monthly iPad app downloads:
Last updated March 2020
Percentage of mobile web traffic from tablets that comes from iPads:
Last updated June 2014
Number of iPads sold (all time):
Last updated 10/30/18
Average number of iPads sold every minute:
Last updated 8/1/16
Average number of iPad Pros sold per minute:
Last updated 8/1/16
2015 was the first year the iPad dropped in sales since its introduction.
iPad percentage of tablet usage in North America:
Last updated 7/22/14
Amount that charging your iPad costs:
Last updated 9/24/15
Number of native iPad apps:
Last updated October 2019
iPad’s share of all streaming video starts from tablets:
Last updated 6/5/15
iPad’s share of the overall tablet market:
Number of iPads sold (quarterly):
- Q3 (calendar) 2018: 9.699 million
- Q2 (calendar) 2018: 11.553 million
- Q1 (calendar) 2018: 9.113 million
- Q4 (calendar) 2017: 13.1 million
- Q3 (calendar) 2017: 10.3 million
- Q4 (calendar) 2016: 13.1 million
- Q3 (calendar) 2016: 9.267 million
- Q2 (calendar) 2016: 9.9 million
- Q1 (calendar) 2016: 10.2 million
- Q4 (calendar) 2015: 16.1 million
- Q3 (calendar) 2015: 9.89 million
- Q2 (calendar) 2015: 10.9 million
- Q1 (calendar) 2015: 12.6 million
- Q3 (calendar) 2014: 12.3 million
- Q2 (calendar) 2014: 13.3 million
- Q1 (calendar) 2014: 16 million
- Q4 (calendar) 2013: 26 million
Number of iPads sold in 2013:
iPad’s tablet usage share in US/Canada:
Last updated 1/27/14
iPad’s tablet market share in China:
Last updated 8/21/13
Percentage of iPad shipments that are iPad Minis:
Last updated 10/1/13
Percentage of iPad revenues from iPad Minis:
Last updated 10/1/13
iPad’s share of the tablet market for the education sector:
Last updated 10/30/14
iPad’s share of global tablets sold in 2013:
Last updated 3/3/14
Estimated amount it costs to build the iPad Air:
between $274-$361
Last updated 11/5/13
Percentage of tablets in China that are iPads:
Last updated 8/1/14
Image credit: Matthew Pearce via flickr

