Physical Address
304 North Cardinal St.
Dorchester Center, MA 02124
Physical Address
304 North Cardinal St.
Dorchester Center, MA 02124

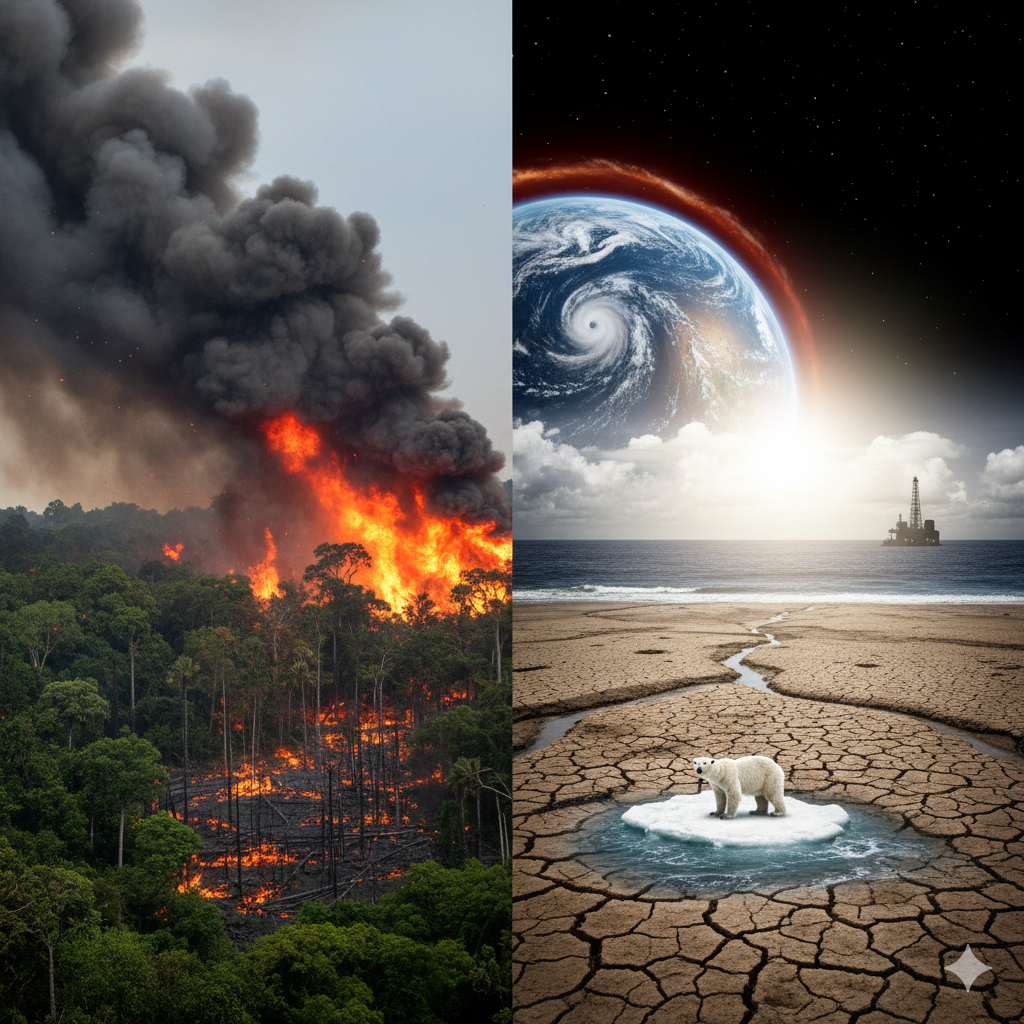
Verified climate change statistics from NASA, NOAA, and UNFCCC: global temperature rise, CO₂ levels, sea level rise, ice sheet losses, Arctic sea ice trends, and U.S. billion-dollar disasters.


Climate change refers to long-term shifts in temperature and weather patterns. NASA notes Earth’s average surface temperature has risen by about 2°F (about 1°C) since the late 19th century, with most of the warming occurring in recent decades.
Note: The statistics below prioritize primary scientific sources (NASA, NOAA, UNFCCC). Values that change over time are labeled with an “as of” date.
| Warming since the late 19th century (NASA) | About +2°F (about +1°C) |
| Warmest year globally (NOAA global record) | 2024 |
| 2025 global rank (NOAA) | 3rd-warmest year in NOAA’s record (1850–present) |
NASA: Evidence
NOAA: 2024 was the world’s warmest year on record
NOAA NCEI: Global Climate 2025 summary
| Mauna Loa CO₂ (NOAA, weekly average) | 429.95 ppm (week beginning Feb 15, 2026) |
NOAA Global Monitoring Laboratory: CO₂ trends (weekly)
| Measured rate since 1993 (NASA) | About 3.4 mm/year (1993–present) |
| Current annual rate (NASA) | About 0.17 in/year (0.44 cm/year) |
NASA Sea Level: Global sea level overview
NASA Sea Level: Global mean sea level indicator
| Greenland ice mass loss (NASA average) | About 266 billion metric tons/year (since 2002) |
| Antarctica ice mass loss (NASA average) | About 135 billion metric tons/year (since 2002) |
NASA Earth Indicator: Ice sheets
| September (summer minimum) trend (NOAA) | −12.1% per decade (1979–2024, relative to the 1981–2010 average) |
NOAA Climate.gov: Arctic sea ice summer minimum
NOAA reported record-high upper ocean heat content in both 2024 and 2025 (top 2000 meters), an indicator of long-term heat accumulation in the climate system.
NOAA NCEI: Global Climate 2024 summary
NOAA NCEI: Global Climate 2025 summary
| Billion-dollar disasters in 2024 (NOAA NCEI) | 27 events (losses > $1B each) |
| Total cost of U.S. billion-dollar disasters in 2024 (NOAA NCEI) | $182.7 billion (as reported in NOAA’s 2024 U.S. climate assessment) |
NOAA NCEI: Billion-Dollar Weather and Climate Disasters
NOAA NCEI: Assessing the U.S. Climate in 2024
The Paris Agreement aims to hold the increase in the global average temperature to well below 2°C above pre-industrial levels and to pursue efforts to limit warming to 1.5°C.
Status of ratification (UNFCCC): 194 Parties (as shown on the UNFCCC status page).
UNFCCC: Paris Agreement text (Article 2)
UNFCCC: Paris Agreement status of ratification